R410A Operating Pressures: Charts, Readings, and Best Practices
Air conditioning and heat pump systems rely on precise pressure balances to operate efficiently. Whether you’re an HVAC technician, a contractor, or a homeowner learning how your system works, understanding R410A operating pressures is crucial. This modern refrigerant has replaced older compounds like R22 due to its environmental advantages, but it comes with specific handling requirements and pressure characteristics.
In this guide, we’ll explore what normal pressures for 410a look like, how temperature influences system readings, and how to interpret various charts like the r410a subcooling chart and 410a superheat chart. Whether you’re troubleshooting a unit or learning the basics, you’ll find practical knowledge here to ensure your systems stay reliable and efficient.
To explore where you can purchase R410A for professional use, visit our R410A Refrigerant for Sale page or learn more about what R410A is and who can legally buy it.
What Is R410A and Why Pressure Matters
R410A refrigerant is a blend of hydrofluorocarbon (HFC) compounds, commonly used in modern air conditioners and heat pumps. It operates at significantly higher pressures than older refrigerants like R22, making it more efficient and suitable for new equipment designs. However, these higher pressures also mean technicians must be precise in charging and servicing systems.
Understanding typical pressures for 410a is not merely about numbers—it’s the key to system health. Incorrect pressures can signal low refrigerant charge, airflow restrictions, dirty coils, or more severe issues. For example, high discharge pressure might indicate overcharging, while low suction pressure might signal a leak or restriction.
R410A systems typically run with suction pressures between 118–135 psi on a 70°F day, while high-side pressures often range from 370–420 psi. But these numbers vary greatly depending on ambient temperatures, indoor loads, and specific equipment designs. That’s why referencing an accurate r410a refrigerant chart is so important.
Understanding R410A Operating Pressures
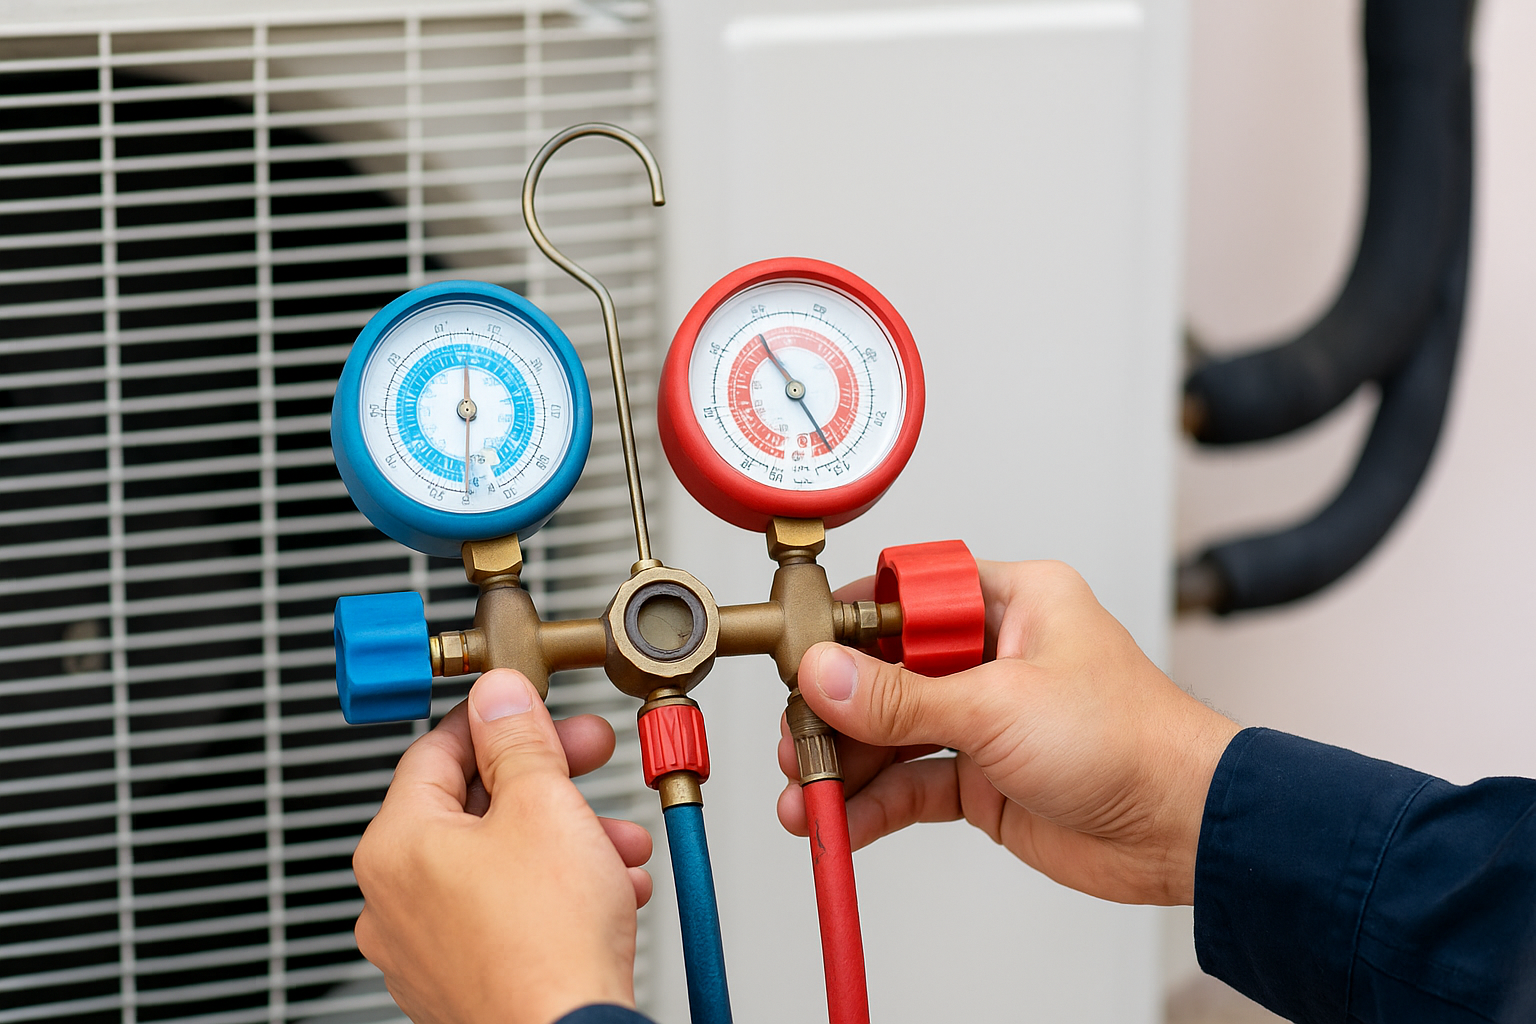
When technicians discuss r410a running pressures, they’re usually referring to two sides of the refrigeration circuit:
Suction (Low Side) Pressure: This is the pressure measured between the evaporator coil and the compressor inlet. For normal 410a operating pressures, it’s common to see readings in the range of 118–135 psi under moderate conditions.
Discharge (High Side) Pressure: This is the pressure between the compressor outlet and the condenser coil. On a typical warm day, high side pressures for R410A may range from 370–420 psi, but can spike higher with elevated ambient temperatures.
These readings are essential for assessing system performance. They allow technicians to identify whether the refrigerant charge is correct, airflow is adequate, and mechanical components are functioning properly. Abnormal readings can quickly point to issues like refrigerant leaks, overcharging, or non-condensable gases in the system.
For anyone working with R410A, knowing what pressure should 410a run at under varying conditions is critical. These pressures determine how efficiently heat is absorbed and released, directly affecting system performance and longevity.
To deepen your understanding of R410A properties, see our article What Is R410A Refrigerant and Can You Legally Buy It?.
The Impact of Temperature on R410A Pressures
One of the most significant factors influencing r410a operating pressures is ambient temperature. On a 70-degree day, suction and discharge pressures are generally lower than on a hot 90°F day. That’s why technicians often refer to charts like the 410a temperature chart or r410a pressure chart high and low side to determine correct readings for the conditions at hand.
For instance, on a moderate day:
- Low side (suction) pressure might read ~125 psi
- High side (discharge) pressure might read ~400 psi
But under high ambient temperatures, those readings could rise significantly. Understanding how to use a charging chart 410a helps prevent overcharging during hotter conditions, ensuring the system operates within safe limits.
Charts like the r410a superheat chart pdf or 410a subcooling chart also factor in ambient conditions. These tools are critical for properly charging systems and ensuring optimal performance.
If you’re curious about how these pressures change in real-life scenarios, don’t miss our insights in the article Where to Buy R410A and Replacement Refrigerants, which covers practical considerations when servicing modern HVAC systems.
Using R410A Pressure Charts Correctly
To truly master r410a operating pressures, you must know how to interpret a proper chart. A r410a pressure chart high and low side provides a map between pressure and temperature. This relationship is vital because refrigerants change state based on pressure. Knowing this connection lets you check if your system is running efficiently or if it’s experiencing issues like overcharging or undercharging.
For example, the r410a subcooling chart helps you ensure liquid refrigerant is fully condensed in the condenser coil before flowing into the expansion device. Subcooling readings indicate how much extra cooling happens below the saturation temperature. Ideal subcooling for many R410A systems often ranges from 8°F to 12°F depending on the unit’s design.
On the other hand, the 410a superheat chart ensures vapor refrigerant leaving the evaporator coil is properly heated above saturation. This prevents liquid refrigerant from entering the compressor, which can cause severe damage. Typically, superheat values for R410A systems hover between 10°F and 15°F under normal conditions, although manufacturer specs vary.
Whenever you’re charging or diagnosing a system, it’s crucial to reference a reliable r410a refrigerant chart. These charts connect your gauge readings to actual system performance. If you’re new to reading charts, check out our helpful guide What Is R410A Refrigerant and Can You Legally Buy It? for foundational knowledge.
Reading R410A Pressure Charts Step by Step
Many technicians struggle with how to read a r410a pressure chart high and low side accurately. Let’s break it down:
Step 1: Measure Ambient Temperature
Check the outside temperature near the condenser coil. For instance, if it’s a 70-degree day, expect lower pressures than during a 95°F heatwave.
Step 2: Measure Suction and Discharge Pressures
Attach gauges to the service ports. Note the suction (low side) and discharge (high side) pressures. Compare these readings against the r410a refrigerant chart or 410a temperature chart to ensure they align with expected values.
Step 3: Compare to Saturation Temperatures
Convert your pressures into saturation temperatures using your chart. This step confirms whether the refrigerant is in the proper phase inside the evaporator and condenser.
Step 4: Calculate Subcooling or Superheat
Subtract your measured liquid line temperature from saturation temperature to find subcooling. For superheat, subtract saturation temp from measured vapor line temp. Reference the r410a subcooling chart or 410a superheat chart to confirm proper operation.
By following these steps, you’ll understand what pressure should 410a run at under any conditions. This knowledge can help prevent costly repairs and improve system efficiency.
If you’d like to deepen your skills with real-world examples, our article Where to Buy R22 and Replacement Refrigerants discusses practical applications for modern refrigerants, including R410A.
Importance of Charts for Mini Splits and Residential Systems
Charts aren’t just for large rooftop systems. Even smaller setups, like mini splits, require precise pressure readings. A 410a mini split pressure chart shows the expected pressures for these compact systems. Many technicians assume mini splits operate the same as larger units, but that’s not true. Their capacity and refrigerant charge volume are lower, so even small deviations in r410a operating pressures can cause performance issues.
For mini splits, referencing a reliable r410a chart helps maintain warranty requirements and ensures comfort levels for homeowners. For deeper insights, read our article What Is R410A Refrigerant and Can You Legally Buy It?.
Common R410A Pressure Problems and Troubleshooting
Even seasoned technicians can run into challenges when working with r410a operating pressures. Let’s look at some of the most common problems and how to solve them using tools like the r410a refrigerant chart and 410a temperature chart.
Low Suction Pressure
When your suction side reads lower than the normal range of 118–135 psi on a 70-degree day, it could indicate issues such as:
- Refrigerant undercharge or leak
- Blocked airflow across the evaporator coil
- Faulty expansion valve
Consult your r410a pressure chart high and low side to determine whether the low readings correlate with low evaporator temperatures. Low superheat readings on the 410a superheat chart may point to overfeeding or liquid flooding the compressor.
High Discharge Pressure
Seeing high-side readings above 420 psi can be alarming. Possible causes include:
- Overcharging with refrigerant
- Dirty condenser coils restricting heat transfer
- Non-condensables in the system
Always cross-check with the r410a subcooling chart to ensure the system isn’t overfilled. Elevated subcooling numbers often confirm overcharge conditions. If high pressures persist, inspect condenser cleanliness and airflow, especially in rooftop systems exposed to high ambient temperatures.
Fluctuating Pressures
Erratic gauge readings are another red flag. This might indicate moisture in the system, a malfunctioning metering device, or unstable compressor operation. If readings swing widely, compare your measurements with values on the r410a chart under similar temperature conditions.
Correct troubleshooting ensures systems remain safe and efficient. Misinterpreting pressures can lead to unnecessary repairs, warranty issues, or even compressor failures. Our guide What Is R410A Refrigerant and Can You Legally Buy It? provides essential knowledge to help avoid these pitfalls.
Why Documentation and Charts Matter
For professionals and DIYers alike, keeping a r410a pressure chart high and low side pdf on hand is invaluable. These charts provide quick references that save time during diagnostics and prevent guesswork. Many manufacturers include printable versions, making it easy to check proper r410a operating pressures on the job.
Equally important is documenting your readings every time you service equipment. Noting suction, discharge, subcooling, superheat, and ambient conditions helps you track changes over time. Trends in your data can reveal subtle leaks or declining performance long before complete failure occurs.
Whether you’re working with a residential split system or a 410a mini split pressure chart, thorough recordkeeping is one of the best habits you can develop as an HVAC professional. If you’d like more insights, visit our article Where to Buy R22 and Replacement Refrigerants for broader context about refrigerant trends and practices.
Final Thoughts on R410A Pressures
Understanding r410a running pressures isn’t just a technical skill—it’s essential for protecting equipment and ensuring safe, efficient cooling. From reading a 410a temperature chart to interpreting a r410a subcooling chart, the knowledge you gain helps you prevent costly breakdowns and improve system performance.
If you’re expanding your skills, don’t forget to browse our resources on what R410A refrigerant is and who can buy it. Or explore our product selection of R410A refrigerants for trusted supplies and expert guidance.
By staying informed and using reliable charts, you’ll confidently answer the question: what pressure should 410a run at—and keep your systems running at peak efficiency.